Hyperspectral imaging lets growers see inside crops by quantifying chlorophyll, water, nitrogen, biomass, and even crop residues weeks before changes are visible to the eye. Decades of peer-reviewed work with Hyperion-class sensors show strong, repeatable links between narrow spectral bands and agricultural variables such as LAI, moisture, and yield. HyperScape100 applies these lessons in space to deliver timely, analysis-ready data and farm-ready insights.
Why hyperspectral is the right tool for early, actionable crop intelligence
Hyperspectral instruments sample hundreds of narrow, contiguous bands that capture pigment, water, and structural signals before stress becomes visible. This is something broadband multispectral indices struggle to quantify. For example, Wyvern’s plant-health primer makes the difference concrete: multispectral (e.g. S2) bands are broad and few, whereas hyperspectral data resolve chlorophyll, carotenoids, anthocyanins, LAI, and red-edge position changes that flag stress, nutritional shifts, and phenology much earlier. [1]
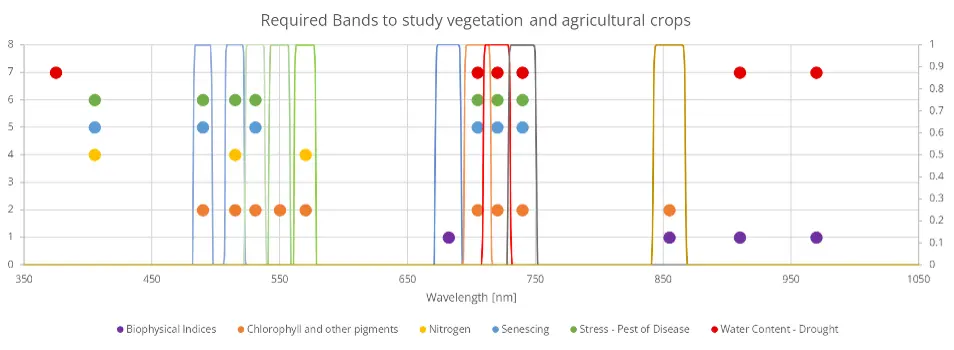
Decades of agronomic literature support this. Narrow-band models centred on the green peak (~550 nm), the red absorption complex (~668, 696, and 682 nm), the red edge (~720 nm), and the moisture-sensitive NIR (~940–1040 nm, especially ~982 nm) routinely outperform broadband NDVI for LAI, biomass, chlorophyll, and water status. These models often provide 3 to 16+ points of explained variance, with R² up to ~0.8–0.9 in several crops. [2]
The HyperScape100 isolates the “hot spots” of those bands into various agricultural applications and modes. GIS teams get analysis-ready reflectance and crop maps that move from “where is it green?” to understanding why a block is deviating, such as pigment vs water vs structure. [3]
Quickstart “recipes” from Wyvern’s hyperspectral index library
Wyvern curates a practical Hyperspectral Index Library, arranged by band and keyword, that can be integrated into HyperScape100 workflows. The library catalogues indices for chlorophyll, stress, algae, and water monitoring, and lets you filter by terms like red edge, nitrogen, xanthophyll, and moisture to shortlist what fits your crop and band set. [1]
Below are field-ready examples, including the rationale and timing for use. In each case, HyperScape100 provides atmospherically corrected reflectance and the necessary narrow bands. Wyvern’s library provides the formulae and band mappings (for VNIR 420–900 nm sensors), which we adapt to HyperScape100’s VNIR coverage when available. [1][3]
A) Vigour and canopy structure
NDVI / SR / EVI / EVI2: These provide fast vigour and canopy density baselines. EVI and EVI2 reduce soil and atmospheric effects in dense crops, which is useful during mid-season leaf-on. Wyvern lists these with band mappings and caveats. Use them to normalise spatial variability before layering stress diagnostics. [1]
B) Chlorophyll and nitrogen proxies (earlier than NDVI)
Red-edge based indices (NDRE-style): These leverage the red-edge reflection to track chlorophyll and nitrogen status where classic NDVI saturates. Wyvern’s plant-health page highlights red-edge position as a sensitive feature for growth phase, canopy stress, and crop ID. HyperScape100’s narrow bands, bracketing ~700–740 nm, improve stability compared to broadband surrogates. [1]
C) Xanthophyll/PRI family (photosynthetic efficiency)
D) Moisture (soil and vegetation)
Wyvern’s “Soil & Vegetation Moisture” guide explains how VNIR–SWIR reflectance varies with water content and why SWIR is decisive for moisture retrieval. It also notes current microwave and optical satellites (SMOS, SMAP, MODIS, S-1) as baselines and the limitations once the canopy closes. Pair that guidance with HyperScape100’s ~982 nm trough for leaf and soil moisture and residue mapping. [1][2]
A two-season, index-driven programme
Phase 1: Establish the baseline (pre-season to early vegetative)
- What you run: NDVI/EVI for uniformity plus red-edge indices for pigment and phase. Map PV, NPV, and soil fractions for stand establishment [1].
In dense canopies, NIR is already high and red is near its absorption minimum, so NDVI saturates quickly (typically around LAI ≈ 2.5–3). Once saturated, moderate chlorophyll changes barely move NDVI, masking early declines. - Why it works: Narrow-band red-edge responds to chlorophyll dynamics earlier than NDVI.
Phase 2: Growth and nutrition (rapid growth)
- What you run: NDRE-style chlorophyll and nitrogen proxies, alongside PRI/xanthophyll-tagged metrics where illumination permits. This helps refine variable-rate nitrogen plans. [1]
Normalised Difference Red-Edge (NDRE) is a family of indices that use the red-edge (the steep rise between red and NIR reflectance) to track chlorophyll content. PRI stands for Photochemical Reflectance Index. It uses narrow green bands sensitive to the xanthophyll cycle, which modulates energy dissipation in leaves. - Why it works: PRI responds to changes in photosynthetic light-use efficiency (LUE), often earlier than pigment or structural metrics. This flags acute physiological stress (heat, high light, water limitation) even when the canopy still looks “green.” Narrow-band indices explained 64–92% of LAI/biomass variability across crops. Red-edge and green features consistently rank among the most informative bands in agronomic studies. [2]
Phase 3: Water, disease, and stress triage
What you run:
- Moisture suite: Use VNIR ~982 nm trough and SWIR absorptions (if available) to detect leaf water decline; use Wyvern’s moisture guidance to set interpretation thresholds and to separate soil and canopy signals. [1][2]
A pronounced water absorption feature occurs around 970–990 nm in vegetation reflectance spectra. In leaf and canopy measurements, this appears as a “moisture trough,” which is a local dip in reflectance driven by liquid water in mesophyll tissues. Imaging spectrometers consistently observe a trough minimum near ~982 nm, flanked by higher reflectance on either side. - Stress/disease: Red absorption and red-edge metrics for pigment loss, plus SWIR lignin and cellulose features for incipient senescence. These combinations flagged sugarcane orange rust and moisture-related stress in spaceborne studies. [4]
Output: “Scout-here” tiles with per-pixel anomaly scores and band-level explainability (e.g. “red-edge shift + 982 nm deepening”). [2]
Phase 4: Harvest and residues
What you run: Late-season red-edge/NIR indices for yield proxies; SWIR lignin/cellulose for residue cover (conservation compliance, carbon accounting). [4]
- The physiological link: Chlorophyll loss and canopy senescence accelerate as crops approach maturity; this weakens red absorption and shifts or softens the red edge (~700–740 nm), while NIR reflectance (linked to leaf and canopy structure) changes with drying, leaf shedding and lodging. These combined spectral changes are directly tied to late-season physiology and therefore to yield formation and its spatial variability.
- Narrow bands around ~682 nm (red absorption) and ~720 nm (red edge) consistently emerge as top information bands for crop biophysics, and pairing them with NIR (≈780–920 nm) avoids NDVI saturation, maintaining sensitivity as canopies peak and then senesce. That is exactly the regime where you want robust yield proxies.
Practical payoff: Late-season red-edge/NIR maps help: (a) schedule and sequence harvests where yield potential remains high; (b) target last-mile scouting for grain moisture and quality; and (c) identify patches of premature senescence that merit separate handling in harvest logistics. (These uses derive from the documented sensitivity of red-edge to chlorophyll and crop phase.)
"Which index when?": a compact playbook
| Situation | Primary signal(s) | Start with | Hyperspectral uplift |
| Baseline vigour | High NIR vs. red contrast | NDVI, SR, EVI/EVI2 | Narrow-band variants reduce saturation and improve repeatability. |
| Early N stress | Red-edge position and slope | Red-edge indices (NDRE-style) | Multiple bands across 700–740 nm allow tuning to cultivar and soil background. |
| Photosynthetic efficiency | Xanthophyll/PRI behaviour | Xanthophyll/PRI indices | Radiometric QC and narrow green/red-edge pairs reveal subtle pre-visual stress shifts. |
| Leaf/soil moisture | 982 nm trough | Wyvern’s Moisture Guide | Precise ~982 nm detection allows earlier drought alerts than broadband sensors. |
| Residue separation | Lignin/cellulose SWIR | SWIR indices (e.g. 1.74 & 2.00 µm) | Accurate NPV and residue mapping that VNIR tools cannot achieve alone. |
Note: The HyperScape100 covers the spectral range from 460 nm to 860 nm. Central Wavelengths (CWL) can be selected in 1 nm steps across this range, with each band having a bandwidth of 3.5% of the selected CWL. These bands can be used to shortlist robust VNIR indices. Fusing SWIR indices with other hyperspectral instruments will aid in observing water and residue physics that VNIR-only sensors cannot detect.
11 Conclusion
HyperScape100 turns hyperspectral science into day-to-day agronomy. By targeting the narrow-band “hot spots” that matter most, the HyperScape100 quantifies pigment, water, and structural change before symptoms are visible. It then converts those signals into field-ready layers for scouting, nutrition, irrigation, harvest, and residue management. In practice, that means moving beyond “where is it green?” to understanding exactly why a block is deviating, whether due to pigment, water, or structure, and acting in time to protect yield.
References and resources
- Wyvern Hyperspectral Library & Knowledge Centre: index browser, plant health explanations, moisture use case notes, and hands-on tutorials (ArcGIS, ENVI, QGIS/EnMAP Box, Python).
- Peer-reviewed agronomy: Narrow band bands/indices for LAI/biomass/chlorophyll/water (incl. best band families and overfit cautions).
- Hyperion agricultural evaluation: ARD (ATCOR) benefits, 26 optimal bands, and satellite to field agreement for key crops.
- EO review (Sentinel 2 context): stress & drought use cases, fusion strategies, and the role of SWIR for moisture/NPV.
Appendix
| Center Wavelength (nm) | Importance and physical significance of waveband in vegetation and cropland studies |
| ULTRAVIOLET | |
| 375 | fPAR, leaf water: fraction of photosynthetically active radiation (fPAR), leaf water content |
| BLUE | |
| 405 | Nitrogen, Senescing: sensitivity to changes in leaf nitrogen. reflectance changes due to pigments is moderate to low. Sensitive to senescing (yellow and yellow green leaves). |
| 490 | Carotenoid, Light use efficiency (LUE), Stress in vegetation: Sensitive to senescing and loss of chlorophyll\browning, ripening, crop yield, and soil background effects |
| GREEN | |
| 515 | Pigments (Carotenoid, Chlorophyll, anthocyanins), Nitrogen, Vigor: positive change in reflectance per unit change in wavelength of this visible spectrum is maximum around this green waveband. |
| 531 | Light use efficiency (LUE), Xanophyll cycle, Stress in vegetation, pest and disease: Senescing and loss of chlorophyll\browning, ripening, crop yield, and soil background effects |
| 550 | Chlorophyll: Total chlorophyll; Chlorophyll/carotenoid ratio, vegetation nutritional and fertility level; vegetation discrimination; vegetation classification |
| 570 | Pigments (Anthrocyanins, Chlorophyll), Nitrogen: negative change in reflectance per unit change in wavelength is maximum as a result of sensitivity to vegetation vigor, pigment, and N |
| RED | |
| 682 | Biophysical quantities and yield: leaf area index, wet and dry biomass, plant height, grain yield, crop type, crop discrimination |
| RED-EDGE | |
| 705 | Stress and chlorophyll: Nitrogen stress, crop stress, crop growth stage studies |
| 720 | Stress and chlorophyll: Nitrogen stress, crop stress, crop growth stage studies. |
| 700-740 | Chlorophyll, senescing, stress, drought: first-order derivative index over 700-740 nm has applications in vegetation studies (e.g., blue-shift during stress and red-shift during healthy growth) |
| NIR | |
| 855 | Biophysical quantities and yield: leaf area index, wet and dry biomass, plant height, grain yield, crop type, crop discrimination, total chlorophyll |
| 910 | Moisture, biomass, and protein: peak NIR reflectance. Useful for computing crop moisture sensitivity index. |
| 970 | Water, Moisture and biomass: Center of moisture sensitive “trough”; water band index, leaf water, biomass |
| FAR NIR | |
| 1075 | Biophysical and biochemical quantities: leaf area index, wet and dry biomass, plant height, grain yield, crop type, crop discrimination, total chlorophyll, anthocyanin, carotenoids |
| 1180 | Water absorption band |
| 1245 | Water sensitivity: water band index, leaf water, biomass. Reflectance peak in 1050-1300 nm. |
| EARLY SWIR | |
| 1450 | Vegetation classification and discrimination: ecotype classification; plant moisture sensitivity. Moisture absorption trough inearly short wave infrared (ESWIR) |
| 1518 | Moisture and biomass: A point of most rapid rise in spectra with unit change in wavelength in SWIR. Sensitive to plant moisture. |
| 1650 | Heavy metal stress, Moisture sensitivity: Heavy metal stress due to reduction in Chlorophyll. Sensitivity to plant moisture fluctuations in ESWIR. Use as an index with 1548 or 1620 or 1690 nm. |
| 1725 | Lignin, biomass, starch, moisture: sensitive to lignin, biomass, starch. Discrimiating crops and vegetation |
| FAR SWIR | |
| 1950 | Water absorption band: highest moisture absorption trough in FSWIR. Use as an index with any one of 2025 nm, 2133 nm, and 2213 am. Affected by noise at times. |
| 2025 | Litter (plant litter), lignin, cellulose, litter-soil differentiation: moderate to low moisture absorption trough in FSWIR. Use as an index with any one of 2025 nm, 2133 nm, and 2213 nm |
| 2133 | Litter (plant litter), lignin, cellulose: typically highest refectivity in FSWIR for vegetation. Litter-soil differentiation |
| 2205 | Litter, lignin, cellulose, sugar, startch, protein: Heavy metal stress: typically, second highest reflectivity in FSWIR for vegetation. Heavy metal stress due to reduction in Chlorophyll |
| 2260 | Moisture and biomass: moisture absorption trough in far short-wave infrared (FSWIR). A point of most rapid change in slope of spectra based on land cover, vegetation type, and vigor |
| 2295 | Stress: sensitive to soil background and plant stress |
| 2359 | Cellulose, protein, nitrogen: sensitive to crop stress, lignin, and starch |